Arthur C. Clarke said “any sufficiently advanced technology is indistinguishable from magic.”
A superintendent once exclaimed “this report is like magic!” when seeing his school district’s attendance matrix for the first time. I told him “No, sir. That’s geography married to enrollment.”
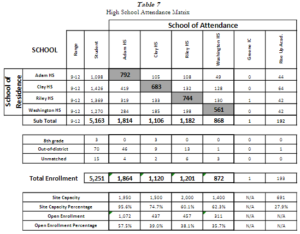
Click here to see the this attendance matrix.
At Davis Demographics, we believe that geography is essential to planning. This means that our forecasts are based on where a student lives, what we call “residence”, not enrollment. We use Esri’s ArcGIS mapping and analysis tools to achieve what to many feels like magic.
Let’s think about enrollment for a moment: What drives a parent to enroll their student at a given school? Many do choose their assigned neighborhood school; however, with the explosion of school choice in the last two decades we can no longer plan accurately based on this. Not only do parents have more choices outside of public education, school districts have been adding new programs to entice parents to stay. These programs only alter enrollment patterns further. Parents are enrolling students in schools where they feel their student will receive an education that best fits that student. A school’s enrollment can fluctuate wildly based on programs, staff, or any number of factors but where a student lives is much less fluid. Residency provides a solid foundation for accurate planning in the face of the shifting sands of enrollment.
Here is some more good news: Enrollment forecasts can be created from your resident forecasts! You can have the resident projections for long-term planning and enrollment projections for staffing and programmatic decision making in the short-term. If you would like to see this in action, schedule a meeting with me or send me an email.